


Page 95 - GHB REIC ปีที่ 10 ฉบับที่ 35
P. 95
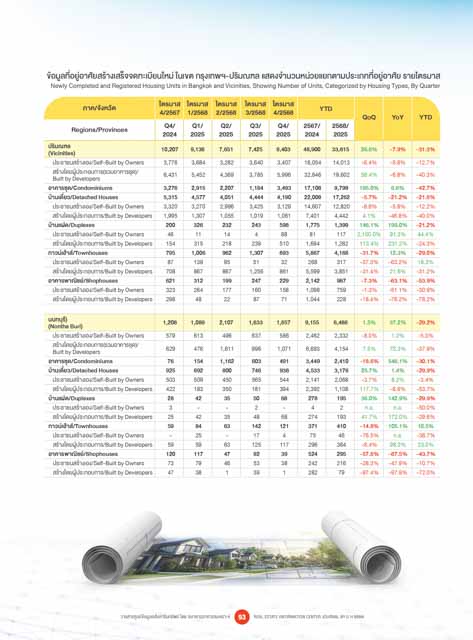
ข้อมูลที่อยู่อาศัยสร้างเสร็จจดทะเบียนใหม่ ในเขต กรุงเทพฯ-ปริมณฑล แสดงจำานวนหน่วยแยกตามประเภทที่อยู่อาศัย รายไตรมาส
              Newly Completed and Registered Housing Units in Bangkok and Vicinities, Showing Number of Units, Categorized by Housing Types, By Quarter

                      ภาค/จังหวัด         ไตรมาส  ไตรมาส  ไตรมาส  ไตรมาส  ไตรมาส
                                          4/2567   1/2568  2/2568  3/2568  4/2568   YTD
                                                                                               QoQ    YoY    YTD
                   Regions/Provinces        Q4/    Q1/    Q2/     Q3/    Q4/    2567/   2568/
                                           2024   2025    2025   2025    2025   2024   2025
              ปริมณฑล                      10,207   9,136   7,651   7,425   9,403   48,900   33,615   26.6%   -7.9%   -31.3%
              (Vicinities)
                ประชาชนสร้างเอง/Self-Built by Owners    3,776     3,684     3,282     3,640     3,407     16,054    14,013    -6.4%   -9.8%   -12.7%
                สร้างโดยผู้ประกอบการ(รวมอาคารชุด)/  6,431     5,452     4,369     3,785     5,996     32,846    19,602    58.4%   -6.8%   -40.3%
                Built by Developers
              อาคารชุด/Condominiums         3,276     2,915     2,207     1,184     3,493     17,108     9,799   195.0%   6.6%   -42.7%
              บ้านเดี่ยว/Detached Houses    5,315     4,577     4,051     4,444     4,190     22,008    17,262    -5.7%   -21.2%  -21.6%
                ประชาชนสร้างเอง/Self-Built by Owners    3,320     3,270     2,996     3,425     3,129     14,607    12,820    -8.6%   -5.8%   -12.2%
                สร้างโดยผู้ประกอบการ/Built by Developers    1,995     1,307     1,055     1,019     1,061     7,401     4,442    4.1%   -46.8%  -40.0%
              บ้านแฝด/Duplexes               200     326     232     243     598     1,775     1,399   146.1%  199.0%  -21.2%
                ประชาชนสร้างเอง/Self-Built by Owners    46     11     14     4     88     81     117    2,100.0%  91.3%   44.4%
                สร้างโดยผู้ประกอบการ/Built by Developers    154     315     218     239     510     1,694     1,282    113.4%  231.2%  -24.3%
              ทาวน์เฮ้าส์/Townhouses         795     1,006     962     1,307     893     5,867     4,168    -31.7%   12.3%   -29.0%
                ประชาชนสร้างเอง/Self-Built by Owners    87     139     95     51     32     268     317    -37.3%  -63.2%   18.3%
                สร้างโดยผู้ประกอบการ/Built by Developers    708     867     867     1,256     861     5,599     3,851    -31.4%   21.6%   -31.2%
              อาคารพาณิชย์/Shophouses        621     312     199     247     229     2,142     987    -7.3%   -63.1%  -53.9%
                ประชาชนสร้างเอง/Self-Built by Owners    323     264     177     160     158     1,098     759    -1.3%   -51.1%  -30.9%
                สร้างโดยผู้ประกอบการ/Built by Developers    298     48     22     87     71     1,044     228    -18.4%  -76.2%  -78.2%

              นนทบุรี)                     1,208   1,089   2,107   1,633   1,657   9,155   6,486   1.5%   37.2%   -29.2%
              (Nontha Buri)
                ประชาชนสร้างเอง/Self-Built by Owners    579     613     496     637     586     2,462     2,332    -8.0%   1.2%   -5.3%
                สร้างโดยผู้ประกอบการ(รวมอาคารชุด)/
                Built by Developers           629     476     1,611     996     1,071     6,693     4,154    7.5%   70.3%   -37.9%
              อาคารชุด/Condominiums          76     154     1,162     603     491     3,449     2,410    -18.6%  546.1%  -30.1%
              บ้านเดี่ยว/Detached Houses     925     692     800     746     938     4,533     3,176    25.7%   1.4%   -29.9%
                ประชาชนสร้างเอง/Self-Built by Owners    503     509     450     565     544     2,141     2,068    -3.7%   8.2%   -3.4%
                สร้างโดยผู้ประกอบการ/Built by Developers    422     183     350     181     394     2,392     1,108    117.7%   -6.6%   -53.7%
              บ้านแฝด/Duplexes               28     42      35     50     68     278     195    36.0%   142.9%  -29.9%
                ประชาชนสร้างเอง/Self-Built by Owners    3     -     -     2     -     4     2    n.a.   n.a.   -50.0%
                สร้างโดยผู้ประกอบการ/Built by Developers    25     42     35     48     68     274     193    41.7%   172.0%  -29.6%
              ทาวน์เฮ้าส์/Townhouses         59     84      63     142     121     371     410    -14.8%  105.1%   10.5%
                ประชาชนสร้างเอง/Self-Built by Owners    -     25     -     17     4     75     46    -76.5%   n.a.   -38.7%
                สร้างโดยผู้ประกอบการ/Built by Developers    59     59     63     125     117     296     364    -6.4%   98.3%   23.0%
              อาคารพาณิชย์/Shophouses        120     117     47     92     39     524     295    -57.6%  -67.5%  -43.7%
                ประชาชนสร้างเอง/Self-Built by Owners    73     79     46     53     38     242     216    -28.3%  -47.9%  -10.7%
                สร้างโดยผู้ประกอบการ/Built by Developers    47     38     1     39     1     282     79    -97.4%  -97.9%  -72.0%


                                วารสารศูนย์ข้อมูลอสังหาริมทรัพย์ โดย ธนาคารอาคารสงเคราะห์  93  REAL ESTATE INFORMATION CENTER JOURNAL BY G H BANK

