


Page 108 - GHB REIC ปีที่ 10 ฉบับที่ 35
P. 108
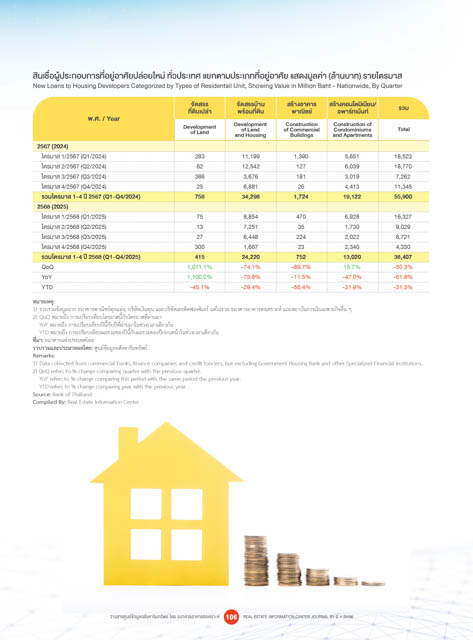
สินเชื่อผู้ประกอบการที่อยู่อาศัยปล่อยใหม่ ทั่วประเทศ แยกตามประเภทที่อยู่อาศัย แสดงมูลค่า (ล้านบาท) รายไตรมาส
          New Loans to Housing Developers Categorized by Types of Residentail Unit, Showing Value in Million Baht - Nationwide, By Quarter

                                                  จัดสรร      จัดสรรบ้าน   สร้างอาคาร  สร้างคอนโดมิเนียม/
                                                  ที่ดินเปล่า  พร้อมที่ดิน  พาณิชย์     อพาร์ทเม้นท์    รวม
                        พ.ศ. / Year
                                                Development   Development   Construction   Construction of   Total
                                                                                       Condominiums
                                                               of Land
                                                  of Land     and Housing  of Commercial   and Apartments
                                                                            Buildings
            2567 (2024)
              ไตรมาส 1/2567 (Q1/2024)              283          11,199       1,390        5,651        18,523
              ไตรมาส 2/2567 (Q2/2024)               62          12,542        127         6,039        18,770
              ไตรมาส 3/2567 (Q3/2024)              386          3,676         181         3,019        7,262
              ไตรมาส 4/2567 (Q4/2024)               25          6,881         26          4,413        11,345
              รวมไตรมาส 1-4 ปี 2567 (Q1-Q4/2024)   756          34,298       1,724        19,122       55,900
            2568 (2025)
              ไตรมาส 1/2568 (Q1/2025)               75          8,854         470         6,928        16,327
              ไตรมาส 2/2568 (Q2/2025)               13          7,251         35          1,730        9,029
              ไตรมาส 3/2568 (Q3/2025)               27          6,448         224         2,022        8,721
              ไตรมาส 4/2568 (Q4/2025)              300          1,667         23          2,340        4,330
              รวมไตรมาส 1-4 ปี 2568 (Q1-Q4/2025)   415          24,220        752         13,020       38,407
              QoQ                                1,011.1%      -74.1%       -89.7%        15.7%        -50.3%
              YoY                                1,100.0%      -75.8%       -11.5%        -47.0%       -61.8%
              YTD                                 -45.1%       -29.4%       -56.4%        -31.9%       -31.3%
          หมายเหตุ:
          1) รวบรวมข้อมูลจาก ธนาคารพาณิชย์ทุกแห่ง, บริษัทเงินทุน และบริษัทเครดิตฟองซิเอร์ แต่ไม่รวม ธนาคารอาคารสงเคราะห์ และสถาบันการเงินเฉพาะกิจอื่น ๆ
          2) QoQ หมายถึง การเปรียบเทียบไตรมาสนี้กับไตรมาสที่ผ่านมา
            YoY หมายถึง การเปรียบเทียบปีนี้กับปีที่ผ่านมาในช่วงเวลาเดียวกัน
            YTD หมายถึง การเปรียบเทียบผลรวมของปีนี้กับผลรวมของปีก่อนหน้าในช่วงเวลาเดียวกัน
          ที่มา: ธนาคารแห่งประเทศไทย
          รวบรวมและประมวลผลโดย: ศูนย์ข้อมูลอสังหาริมทรัพย์
          Remarks:
          1) Data collected from commercial banks, finance companies and credit fonciers, but excluding Government Housing Bank and other Specialized Financial Institutions.
          2) QoQ refers to % change comparing quarter with the previous quarter.
            YoY refers to % change comparing this period with the same period the previous year.
            YTD refers to % change comparing year with the previous year.
          Source: Bank of Thailand.
          Compiled By: Real Estate Information Center


                             วารสารศูนย์ข้อมูลอสังหาริมทรัพย์ โดย ธนาคารอาคารสงเคราะห์  106  REAL ESTATE INFORMATION CENTER JOURNAL BY G H BANK

